
How to Check TikTok Analytics: Complete Dashboard Guide (2026)
Direct Answer
To see your **TikTok analytics**, open TikTok → tap your profile → tap the **☰ menu (top-right)** → tap **Creator Tools** → tap **Analytics**. You'll see three tabs: **Overview** (video views, profile views, likes, followers), **Content** (individual video performance), and **Followers** (demographics and active times). You need a **Business or Creator account** (free to switch). For competitor analytics and benchmarking, use a third-party **TikTok tool** like **ContHunt**.
How to Check TikTok Analytics: Complete Dashboard Guide (2026)
If you’re creating TikTok content without checking your analytics, you’re making videos in the dark. Your TikTok analytics dashboard tells you exactly what’s working, what’s not, who’s watching, and when they’re online.
The good news: TikTok analytics are free, detailed, and available on both mobile and desktop. The challenge: knowing which metrics actually matter in 2026 and how to turn data into better content decisions.
This guide shows you exactly how to see TikTok analytics, breaks down every section of the dashboard, identifies the metrics that matter most for the 2026 algorithm, and recommends the best TikTok tools for going beyond native data.
How to Access TikTok Analytics (Step-by-Step)
On Mobile (iPhone & Android):
- Open TikTok and tap Profile (bottom-right).
- Tap the ☰ menu (top-right).
- Tap Creator Tools.
- Tap Analytics.
On Desktop:
- Go to analytics.tiktok.com.
- Log in with your TikTok credentials.
- Your full dashboard loads with export options.
Prerequisite: Business or Creator Account
TikTok analytics are only available for Business and Creator accounts. If you have a Personal account, switch for free:
- Settings → Manage Account → Switch to Business Account
- This is instant, free, and doesn’t affect your content or followers.
The TikTok Analytics Dashboard: Every Section Explained
TikTok’s native analytics are organized into three main tabs. Here’s what each contains and what matters most in 2026.
Tab 1: Overview
The Overview tab gives you a high-level snapshot of your account performance.
| Metric | What It Measures | Why It Matters |
|---|---|---|
| Video Views | Total views across all videos | Overall content reach |
| Profile Views | How many people visited your profile | Intent to follow or explore |
| Likes | Total likes received | Basic engagement signal |
| Comments | Total comments received | Deeper engagement signal |
| Shares | Total shares received | Strongest viral signal |
| Followers | Net follower change | Growth velocity |
2026 Pro Tip: Don’t obsess over total views. Focus on the views-to-profile-visits ratio. If views are high but profile visits are low, your CTA or bio connection is weak.
Tab 2: Content
The Content tab shows individual video performance. This is where the real insights live.
For Each Video You’ll See:
- Total Views
- Total Likes, Comments, Shares
- Average Watch Time — The most important metric for the 2026 algorithm
- Watched Full Video — Percentage of viewers who completed the video
- Traffic Source — Where views came from (For You Page, Following, Search, Profile, Sound)
- Audience Territories — Geographic breakdown
Key Metrics to Prioritize:
- Average Watch Time / Completion Rate: This is the #1 signal the algorithm uses to decide whether to push your video further. A completion rate above 60% is strong.
- Traffic Source: For You Page %: If most views come from FYP, the algorithm is actively distributing your content. If most come from Following, your content isn’t breaking out to new audiences.
- Shares: The highest-weight engagement signal in 2026.
Tab 3: Followers
The Followers tab reveals who your audience is and when they’re active.
You’ll See:
- Total Followers and net change
- Gender Breakdown
- Top Territories (Countries)
- Follower Activity — Days and hours when your followers are most active
2026 Pro Tip: Use “Follower Activity” to schedule your posts. Posting when your audience is most active gives the algorithm an early engagement signal that accelerates distribution.
The 5 TikTok Metrics That Actually Matter in 2026
With dozens of data points available, here are the five you should check weekly:
1. Completion Rate (Most Important)
Where to find it: Content tab → individual video → “Watched Full Video” Why it matters: The 2026 algorithm weights completion rate more heavily than any other signal. If people finish your video, TikTok pushes it further. Benchmark: >60% is good, >80% is excellent.
2. Share Rate
Where to find it: Content tab → individual video → Shares / Views Why it matters: Shares grew 45% YoY on TikTok. A share means your content is valuable enough for someone to attach their identity to it. Benchmark: >1% share-to-view ratio is strong.
3. FYP Traffic %
Where to find it: Content tab → individual video → Traffic Source Why it matters: If less than 50% of views come from the For You Page, the algorithm isn’t distributing your content to new audiences. Adjust your hooks and hashtags.
4. Profile Visit Rate
Where to find it: Overview → Profile Views / Video Views Why it matters: Profile visits convert watchers into followers. A strong profile visit rate means your content creates curiosity about your brand.
5. Follower Growth Velocity
Where to find it: Overview → Followers (net change over 7/28 days) Why it matters: Velocity matters more than total count. Consistent growth of 1-3% monthly is healthy for most accounts.
Best Third-Party TikTok Analytics Tools (2026)
TikTok’s native dashboard covers your own account. For competitor tracking, advanced analytics, and cross-platform intelligence, you need third-party TikTok tools.
| Tool | Best For | Competitor Tracking | Free Plan | Starting Price |
|---|---|---|---|---|
| ContHunt | Competitive intelligence | ✅ | ✅ | $29/mo |
| Pentos | Hashtag & sound tracking | ✅ | Trial | $49/mo |
| Exolyt | Video-level analytics | ✅ | ✅ | $49/mo |
| Socialinsider | Cross-platform analytics | ✅ | Trial | $99/mo |
| Sprout Social | Enterprise reporting | ✅ | Trial | $199/mo |
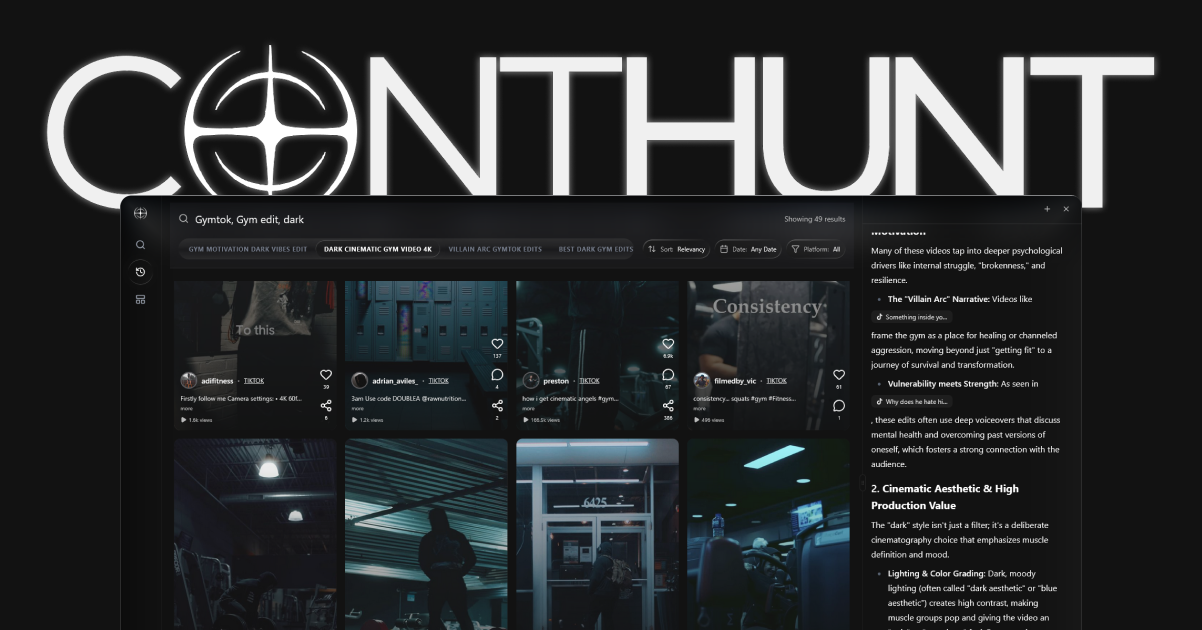
ContHunt for TikTok Analytics
ContHunt fills the biggest gap in TikTok’s native analytics: competitive intelligence. While TikTok only shows your own data, ContHunt lets you:
- Track competitor posting frequency and engagement rates
- Identify outlier content (posts performing 2x+ above average)
- Analyze the hooks and formats driving competitor success
- Benchmark your performance against niche averages
Related: TikTok Hashtags to Go Viral: Complete Strategy Guide
How to Read Your TikTok Analytics (Interpretation Guide)
Raw numbers are useless without interpretation. Here’s how to read the most common scenarios:
Scenario 1: High Views, Low Followers
Diagnosis: Your content entertains but doesn’t create enough curiosity about your brand. Viewers watch and move on. Fix: Add a stronger CTA (“Follow for Part 2”), improve your bio to clearly state your value, and create series content that rewards following.
Scenario 2: High Completion Rate, Low Views
Diagnosis: Your content quality is high, but the algorithm isn’t distributing it widely—likely a hook or hashtag problem. Fix: Rewrite your opening hook. Test pattern-interrupt openers (“Stop scrolling if you…”). Review your hashtag strategy.
Scenario 3: High FYP %, Low Engagement
Diagnosis: The algorithm is testing your content with new audiences, but they aren’t engaging. Your content may not match the expectation set by the thumbnail/title. Fix: Ensure your first 3 seconds deliver on the promise of your caption and hashtags (Triple Alignment).
Scenario 4: High Shares, Low Comments
Diagnosis: Your content is valuable enough to share but doesn’t provoke conversation. Fix: Add a question or opinion to your caption. Use a “hot take” format to invite debate in the comments.
Common TikTok Analytics Mistakes
Mistake 1: Checking Analytics Too Soon
Give every video at least 48 hours before analyzing. TikTok’s distribution cycle can take 24-72 hours to complete.
Mistake 2: Obsessing Over Follower Count
Followers are a lagging indicator. Focus on completion rate, shares, and FYP traffic as leading indicators of growth.
Mistake 3: Ignoring Traffic Sources
If 90% of your views come from “Following,” you’re a private newsletter, not a discovery channel. Adjust your hashtag strategy to reach non-followers.
Mistake 4: Comparing Across Content Types
A 15-second dance clip and a 90-second tutorial will have wildly different metrics. Compare within content types, not across them.
2026 TikTok Analytics Checklist
- [ ] Have I switched to a Business or Creator account?
- [ ] Am I checking analytics at least weekly?
- [ ] Am I tracking Completion Rate as my #1 metric?
- [ ] Am I monitoring FYP Traffic % for each video?
- [ ] Do I know my followers’ most active times?
- [ ] Am I using ContHunt for competitive benchmarking?
- [ ] Am I giving videos 48 hours before analyzing?
Conclusion
TikTok analytics are your content strategy compass. They tell you what the algorithm rewards, what your audience values, and where the gaps are. The creators who check, interpret, and act on their analytics consistently are the ones who grow.
Start with TikTok’s native dashboard for your own data. Layer in ContHunt for competitive intelligence. And remember: the most important metric in 2026 is completion rate—not likes, not followers, not views. Make videos people can’t stop watching, and the algorithm will do the rest.
Recommended Next Steps:
Key Data Points
Monthly Users
1.59 Billion
TikTok's monthly active users in 2026, making analytics understanding essential for any serious creator.
Data Window
7, 28, or 60 Days
TikTok's native analytics dashboard allows you to view data across three time ranges for trend analysis.
Completion Rate Weight
~82%
The estimated weight the 2026 TikTok algorithm gives to watch completion rate, making it the most important metric to track.
Expert Quotes
"Your TikTok analytics tell you what happened. Competitive analytics from ContHunt tell you what to do next."
Sources
- TikTok Creator Academy · TikTok